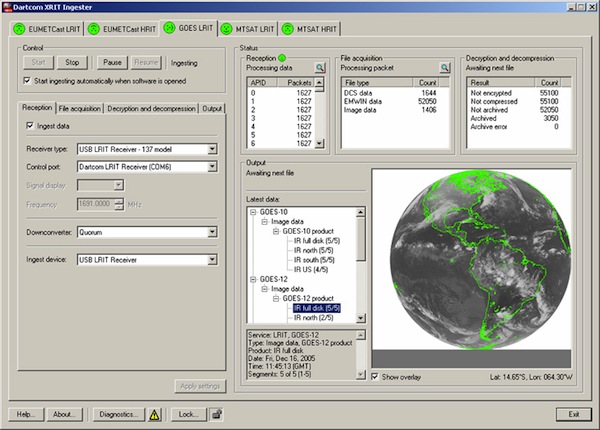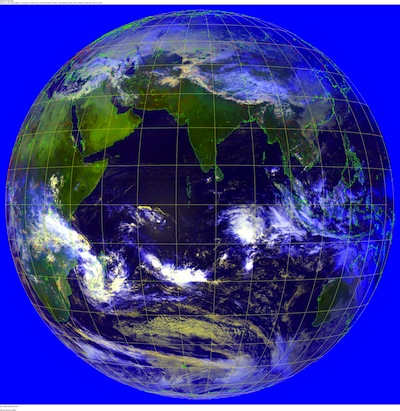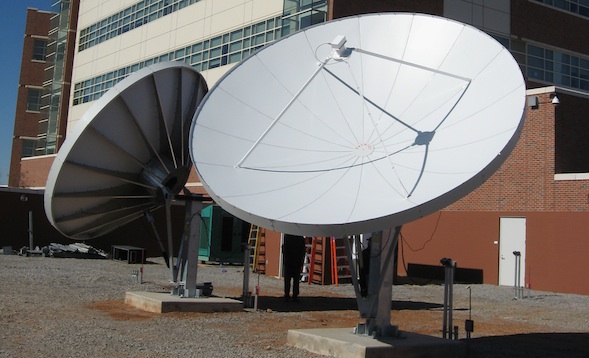


Global Imaging’s EarthTracer is a fully integrated, direct readout ground station for the reception and processing of data from geostationary spacecraft including NOAA GOES I – M satellites, European Meteosat, and Japanese MTSAT. The EarthTracer ground station includes a powerful LINUX ingest server, software for automated, uninterrupted data collection, data processing software, and a collection of general image processing and display functions. Earth Tracer data processing software includes functions for GOES GVAR processing. Options for Windows XP platforms receiving LRIT, EMWIN, DCS and HRIT imagery and data.
Automatic Operation
The EarthTracer ground station is completely automatic. System managers control the automatic operation of the system using Global Imaging’s Automatic Satellite Acquisition and Processing Manager (ASAPMGR) windows software. ASAPMGR software allows the system manager to specify completely the sectors to be extracted from each data transmission.
Real-Time Sectorizing
Sectors are extracted from the data telemetry and stored on the workstation disk in real time. Sectors are defined by specifying the center latitude/longitude (or the satellite line and sample coordinates), the extent of the sector (the number of lines and number of samples in the sector), the channel number of the data to be extracted, the data resolution in integer increments from 1 to 128, and the percent of area coverage of the sector. Sectors are created from all possible modes of data transmission including rapid scan and other special modes of transmission.
Global Imaging EarthTracer software allows sectors to overlap. EarthTracer software accommodates simultaneous ingestion of multiple sectors at multiple resolutions. Reduced resolution and full resolution sectors can be ingested simultaneously. Reduced resolution sectors can be of any size and location up to and including the full earth scan. Calibration and navigation information is extracted and stored for each sector. EarthTracer systems provide for the simultaneous extraction of up to 200 sectors.
McIDAS-X Compatibility
Sectors can be written in Global Imaging’s proprietary file format or optionally in McIDAS-X compatible format. Global Imaging offers an ingest option which provides for seamless compatibility with McIDAS X viewing and processing software. EarthTracer software allows the user to specify the directory and area numbers for the ingested sectors and the number of sequential images to be extracted per sector.
Data Processing Software
Each EarthTracer ground station includes a complete set of data processing software for precision navigation, radiometric calibration, and interpolation to standard map projections.
Special Analysis Software
Cloud Top Heights The infrared data is used to estimate the temperatures of the cloud tops. Cloud top temperatures are combined with radiosonde data and conventional temperature analyses using an interactive computer process to determine the height of the tops of clouds.
Sea Surface Thermal Patterns
By saving the warmest values of infrared brightness temperatures for a period of time, the effect of clouds in the field of view is reduced and the thermal patterns of the sea surface are preserved. The major ocean thermal features revealed include the Gulf Stream and its major meanders and eddies, the Gulf of Mexico Loop Current and the changing flow patterns in equatorial ocean currents.
Quantitative Precipitation Estimates
A combination of manual interpretation and interactive computer enhancement of both the visible and the infrared imagery is used to estimate the amount of precipitation coming from convective storm systems and hurricanes.
Weather Warnings
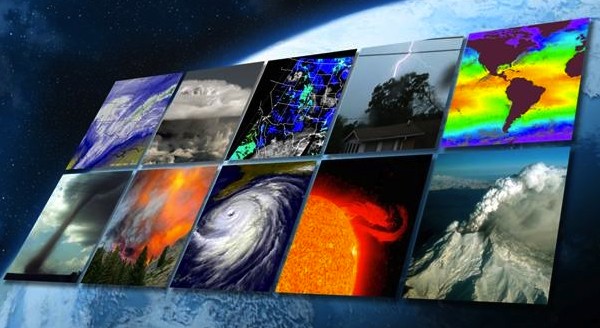
Imagery from geostationary satellites are used by the National Weather Service to provide a weather warnings and forecasts. The National Hurricane Center (NHC) and local forecast offices use sequential GOES images collected using EarthTracer ground stations to identify, track and estimate the intensity of developing tropical storms and hurricanes for an area that stretches across the Atlantic Ocean to west of the Hawaiian Islands in the Pacific. Satellite imagery is often the only source of real-time information across this vast oceanic area.
Sea Fogs Sequential ocean images are analyzed to detect fog at sea.
Calculation of the Earth’s Energy Balance
The Earth’s energy balance is calculated, by regions, with solar input reduced by infrared heat radiation losses to space to determine net regional energy gains. The results are useful in climate studies and to assess the impact of events such as volcano explosions on short-term weather .
Image and Graphics Display
For displaying and interactively manipulating graphics and image data, Global Imaging provides FOCUS software with each ground station. FOCUS software includes functions for altering image contrast and brightness, for overlaying latitude longitude grids and for automatically drawing coastlines from an on-line worldwide database. FOCUS provides for eight independent graphic overlay planes and pseudocolor and monochrome lookup tables. Operators can also use FOCUS to pan and zoom image data, annotate images, and play animation loops.
